colors-of-the-wind
Colors of the Wind
Version 1 (2021-2022)
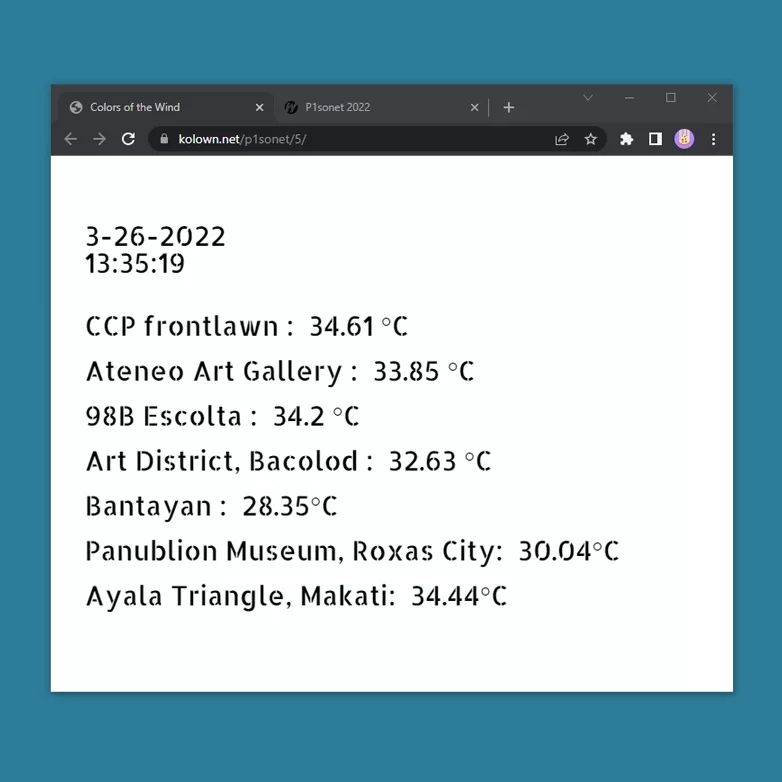
An online experiment by KoloWn that tapped into real-time environmental data from third-party sources, visualized through a dynamic web interface.
Version 2 (2023)
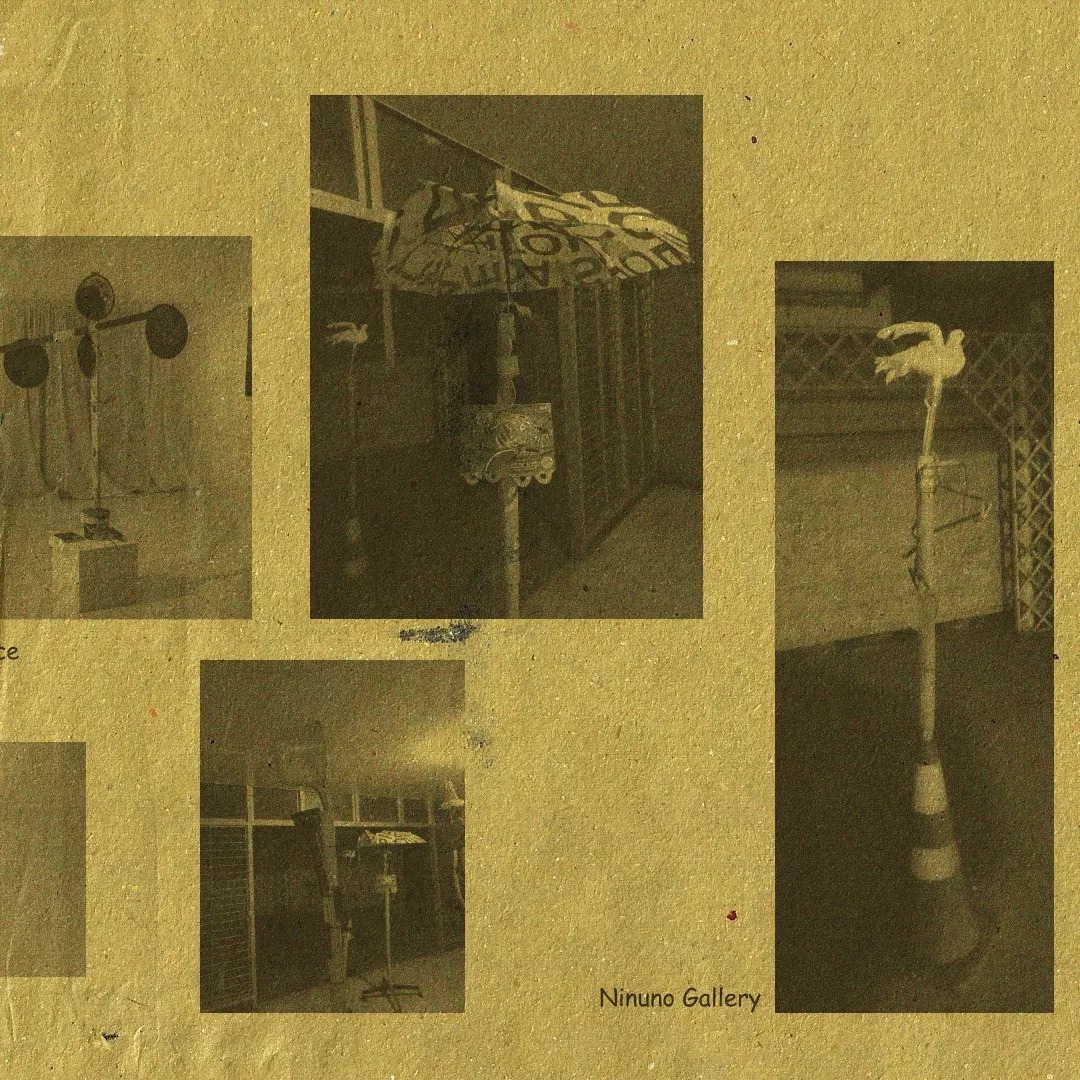
Translated into a physical installation at Joya Gallery (Cebu), Punlaan Art Space(Cavite), Ninuno Gallery(QC) in 2023, called Stations. Inspired by rural antennas and street barricades, this iteration explored how infrastructure can become both signal and sculpture.
Version 3 (Upcoming) A hybrid approach that integrates real-time weather data from PAG-ASA with custom-built systems. This version will extend the project’s dialogue between digital streams and physical presence, shaping a new interface where climate information becomes both tangible and poetic.
Colors of the Wind — Version 3
Conceptual Frame
If Version 1 was about seeing data and Version 2 about embodying infrastructure, Version 3 becomes about building weather language. By combining PAG-ASA’s real-time weather streams with custom-built receivers and sculptural interfaces, this iteration shifts from passive visualization to active translation—turning climate into signal, story, and play.
Objectives
Invent a DIY weather station: Construct instruments—antennas, barricades, or hybrid objects—that both capture and perform weather.
Localize the climate: Root the project in the Philippines via PAG-ASA data, tying climate information to everyday rhythms and vulnerabilities.
Expose unpredictability: Embrace glitches, delays, and mismatches as aesthetic features, highlighting the fragility of human attempts to “read” the weather.
Fuse science and sculpture: Treat meteorological tools as art objects, collapsing the boundary between infrastructure and installation.
Make weather witty: Translate humidity, rainfall, or wind into playful metaphors—stations that “sweat,” barricades that “shiver,” antennas that “sing.”
Produce a catalog/manual: Document the process and provide guides for building stations, turning the project into an open-source toolkit for artists, communities, and educators.
Experiment with dynamic interfaces: Develop interactive, evolving user interfaces that respond to both PAG-ASA data and DIY station inputs—interfaces that shift in real time, glitch, or morph, making climate information feel alive and unpredictable.